Are Your Safety Instrumented Systems Proof Tests Effective?
Many people assume that a proof test of a safety function is 100% effective.
#knowyourvalves
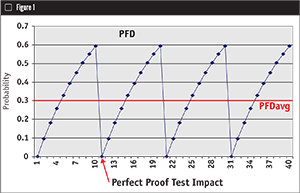
A weak proof test design can impact the effectiveness of a safety function significantly, which can be shown through the average Probability of Failure on Demand (PFDavg) calculations.
This article explains proof test coverage for valves, actuators and solenoids and why this test is an important safety parameter. It also shows that the real objective is to detect failures that are not detected by any automatic diagnostics, and points out that safety instrumented systems (SIS) products will have much higher safety even with a lower proof test coverage if automatic diagnostics are used. In other words, it explains why a lower proof test coverage is not a bad thing.
WHAT IS A PROOF TEST?
Proof testing, which is an important part of safety design, is receiving an increasing amount of attention today. Most engineers who design and verify safety instrumented functions (SIF) understand how hard it is to design a manual proof test with high effectiveness. However, confusion exists on what must be included in the test and what coverage should be claimed.
A proof test is a test designed to uncover failures within the SIF that would otherwise be undetected and that prevent the protection function (dangerous failures). In general, the more frequently a proof test is run and the more extensive the test is, the greater the safety integrity.
Proof test coverage is expressed as a percentage of failures classified as undetected dangerous failures. Coverage is expressed as a range of 0–100%. Typical values range from 40-90%.
PROOF TEST DESIGN
The final step in conceptual design of equipment is to perform the safety integrity level (SIL) verification calculations to see if that equipment, its architecture and the test philosophy will achieve desired risk reductions. When designing a proof test, both the functional requirements, such as what the SIF needs to do, and the performance requirements, such as the leakage and timing parameters and any exceptions to the safety manual, are considered.
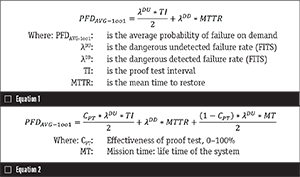
Simplified equations have been used to model SIFs. These equations can be useful for quickly approximating the reliability of an SIF. However, several pitfalls in using simplified equations exist. For example, the equations given often do not account for imperfect proof testing and mission time (lifetime of the system). Equation 1 above is the simplified equation often given for a one out of one (1oo1) function. This equation results in the PFDavg for a single SIF as a function of the dangerous failure rate in terms of Failures in Time (FITS), expressed in the rate of a device, which is the number of failures that can be expected in one billion (109) device-hours of operation.
For a valve, a proof test that only confirms that the valve can fully stroke typically has effectiveness of about 70% (proof test coverage may be much lower even if tight shutoff performance is required). If this valve is modeled as having perfect proof testing, the PFD for the valve will be underestimated. Equation 2 is the simplified equation for a 1oo1 function and accounting for proof test coverage.
Yet, these questons arise: Why is a proof test not perfect? Is everything tested? If a functional test is run and we see the system respond, then does that mean everything we need to work does work? If not, what’s the problem?
As an example look at a proof test where a pressure sensor is isolated and pumped up such that the sensor pressure exceeds the trip point. The remote actuated valve is observed to verify it moves, but there are many dangerous failures that might not be detected with the proof test mentioned. Those include:
- The valve seat may not seal properly.
- If response time is not measured, component failure may be causing the speed of response to exceed process safety time.
- Process connections to the sensor may fail.
- Power supply droop/wire resistance may be limiting maximum current disabling diagnostic alarms.
PFDavg Example
To demonstrate the significance of this, consider a high-level protection SIF. The proposed design has a single SIL 3-certified level transmitter, an SIL 3-certified safety logic solver and a single remote-actuated valve consisting of a certified solenoid valve, a certified scotch yoke actuator and a certified ball valve.
First analyze the SIF with the following variables selected to represent results from simplified equations:
- Mission time = 25 years
- Proof test interval = 1 year for the sensor and final element and 5 years for the logic solver
- Proof test coverage = 100%
- Proof test done with process offline
- MTTR = 48 hours
- Mission time = 25 years
- Proof test interval = 1 year for the sensor and final element, 5 years for the logic solver
- Proof test coverage = 90% for the sensor and 70% for the final element
- Proof test duration = 2 hours with process online
- MTTR = 48 hours
Maintenance capability = “Medium” for the sensor and final element, “Good” for the logic solver with all other variables remaining the same.
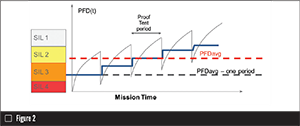
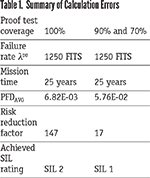
The comparison of the results show that assuming 100% proof test coverage results in overestimating the risk reduction by a factor of 8.5 times. This is a significant error that will impact the reliability of the SIF. To ensure that accurate results are achieved, equations that account for proof test coverage must be used. Because of the complexity of these equations, it often is beneficial to use more advanced techniques such as Markov models (or software) that directly account for factors such as proof test coverage, repair times and other variations.
HOW TO KNOW PROOF TEST EFFECTIVENESS
One accurate method of predicting proof test effectiveness is to review all the components in a product by failure mode and record or test whether a specific manual proof test would detect that particular component’s failure. This can be done through a product Failure Mode, Effect and Diagnostic Analysis (FMEDA) on a cross-sectional drawing of the product and assigning the appropriate functional failure modes, resulting in a product failure rate expressed in FITS (10-9).
The following simple process helps to determine the effectiveness of each of those proof tests:
- Establish a reasonable baseline failure rate for a device.
- Perform an FMEDA with appropriate functional failure modes.
- Assign coverage as a function of failure mode and test.
- Evaluate effectiveness through the diagnostics and proof tests.
It should be understood that a manual proof test is done to detect failures that are not detected by automatic diagnostics. Tests designed to detect the same failures as the automatic diagnostics consume time, increase costs and accomplish little.
Proof test coverage is a measure of how many undetected dangerous failures are detected by the proof test. Imagine a product with 100 FITS of dangerous failures. Automatic diagnostics are poor and will detect only 10 FITS. That means λDD is 10 FITS and λDU is 90 FITS. Imagine that a manual proof test can be done during operation that can detect 72 of the 90 FITS. The proof test coverage is 72/90 or 80%. In other words, 18 FITS of dangerous failures are never detected.
What about a similar product with good automatic diagnostics that can detect 90 of the 100 FITS? In this case, the λDD is 90 FITS and the λDU is 10 FITS. Imagine the same proof test has been used, but the automatic diagnostics have already detected 70 of the 72 FITS. The proof test now detects two of the 10 FITS and proof test coverage is at 20%. That does not sound impressive, but the bottom line is that in the first case, the automatic diagnostics, combined with the proof test, detect all but 18 FITS. In the second case, automatic diagnostics combined with a proof test detect all but eight FITS. Looking at it this way shows a much better situation.
This illustrates why we should never use proof test coverage as a measure of quality for a product and why the opposite may well be true.
As automatic diagnostics get better, manual proof test coverage goes down, total detected DU failures (those detected by automatic and manual testing) increase and the PFDavg drops.
HOW MUCH DIFFERENCE CAN A PROOF TEST MAKE?
Proof testing is an important part of the management of safety instrumented functions. When testing the final element, we check to see how it functions and whether it is meeting its safety criteria. For example, if we have a floating ball valve, we can design at least five different proof tests for the valve:
PT1 = Partial valve stroke test
PT2 = Full valve stroke test
PT3 = Full valve stroke test at operating conditions
PT4 = Full valve stroke test and leak test
PT5 = Full valve stroke test at operating conditions and leak test
Test 1 or PT1 is a partial stroke test where the valve is moved only 5–10% of its total stroke. We could also perform a full valve stroke test where the valve is opened 100% of its total stroke (PT2). Full valve stroke tests are usually done when the process is down, so another variation would be a full valve stroke test at operating conditions (PT3). A fourth test, PT4, would do a full valve stroke test with an added leak test. As with full tests, the system would be down during PT4 so we could do that same test except at operating conditions (PT5). Those are the five proof tests that could be carried out on that valve assembly.
Which proof test would you use? If, for example, you have a full stroke test of a remote valve assembly as a manual proof test, but it is not tested at operating conditions, which would apply? This would be PT2, so it does not provide 100% coverage. This test is more effective in detecting failures in solenoid valves and actuators where the primary function of mechanical movement can be observed. The test does not do well in detecting damage to valve seats because such damage is not typically observed. However, if we are going to try to stroke test the valve, time it, and do a leak test, the proof test would fall under PT4.
SIF PROOF TEST EXAMPLE
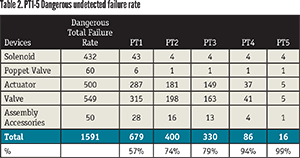
Table 2 shows each device listed with the associated total dangerous failure rate in FITS (10e-09) and evaluates each device at every proof test level in the FMEDA process. As you raise a level in proof test effectiveness, more and more dangerous failures are detected. This means that undetected failures are turning into detected failures, leaving the undetected failure rate to descend. Looking at the entire SIF, the differences between proof tests begins to stack up, which could have a significant impact. For example, comparing Proof Test 1 through Proof Test 5, 663 FITS dangerous undetected failures quite possibly are unaccounted for!
SUMMARY
To summarize: A realistic PFDavg calculation depends on several variables, including realistic proof test coverage. This coverage can be measured by a detailed examination of a product, which shows that proof test coverage can impact PFDavg by an entire SIL level.
Loren Stewart, CFSE, is senior safety engineer for Exida Consulting (www.exida.com). Along with assessing the safety of products and certifications, she continually researches and has published reports on stiction, the 2H initiative according to IEC 61508 comparing failure rates and writing a book on the functional safety of final elements. Reach her at lstewart@exida.com.
Some Terminology
Because many VALVE readers are not safety experts, here are a few of the terms in this story that are commonly used in the industry and what they mean:
Safety function—the purpose of the valve/actuator/solenoid/SIF is to take the system to a safe state when needed
Automatic diagnostics—a system test done automatically after a period of time
Manual diagnostic—a system test done as a manual test after a period of time
RELATED CONTENT
-
An Introduction to Axial Flow Check Valves
Check valves are self-actualizing devices that respond to both pressure and flow changes in a piping system.
-
Operational Basics of Safety Valves
These spring-loaded valves provide overpressure protection for downstream equipment.
-
The Different Types of Solenoid Valves and How They Work
Solenoid valves are automatic flow control devices popular across different industrial applications.






 Unloading large gate valve.jpg;maxWidth=214)