MDM Mid-Year Economic Update: Slowing Growth for 2019
Though 2018 represented a strong year of revenue growth in most sectors, the second half of 2019 will likely show a downshift.
2018 PERFORMANCE IN 19 WHOLESALE DISTRIBUTION SECTORS
Lewandowski showed data and forecasts for 19 major wholesale distribution sectors. Among these, the largest was oil and gas products; the smallest was furniture and home furnishings.
In 2018 most sectors showed growth. Those with double-digit revenue growth were oil and gas products (23.4%), metal service centers (17.1%), industrial distributors (13.6%), and chemicals and plastics (10.4%). The value of the oil and gas sector’s growth was somewhat inflated due to product prices, Lewandowski pointed out. On the bottom end, two of the wholesale distribution sectors showed small contractions in 2018: apparel and piece goods (-0.4%), and grocery and foodservice (-1.2%).
The overall 2018 revenue growth for the 19 sectors was 6.8%, which, when adjusted for price inflation, came to 1.4%.
FORECASTS FOR 2019 AND 2020
Lewandowski outlined forecasts for the wholesale and distribution sectors for the rest of 2019 and for 2020 (See Table 1). For the year 2019, the overall revenue growth for the sectors covered is forecast as 2.4%, as compared to 6.8% for 2018. For 2020, Lewandowski noted a forecast of 4.4% overall revenue growth for these sectors.
Table 1. Year’s revenue growth expectations by sector
Table courtesy of MDM; sources: U.S. Census Bureau, Monthly Wholesale Trade; MDM 2019 Wholesale Distribution Economic Trends Report
In 2019, the oil and gas sector is likely to show nearly the same revenue as in 2018, with just under 1% growth year-to-year. In 2020, however, he said, the forecast is for 9.7% growth for this sector.
In 2019, the greatest growth was forecast for metal service centers (6.4%); beer, wine and liquor wholesalers (6.3%); and pharmaceutical wholesalers (5.1%). On the other extreme, agricultural products are expected to fall 5.8% from their 2018 level and computer equipment and software wholesale distribution is expected to contract slightly, by 0.9%.
In 2020, the oil and gas (9.7%), pharmaceutical (8.3%) and chemicals and plastics (7.2%) sectors show the highest year-to-year growth forecasts. Sectors forecast to show revenue contraction between 2019 and 2020 were industrial distributors (-3.90%), furniture and home furnishing wholesale distributors (-3.80%) and computer equipment and software wholesale distributors (-2.60%).
UPSIDE AND DOWNSIDE
To investigate what could happen in conditions somewhat better and worse than the baseline forecast, the analysis also used alternative scenarios, Lewandowski said.
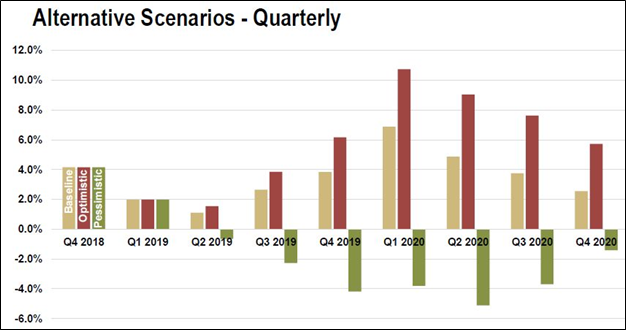
Forecasting with more optimistic or more pessimistic estimates for future GDP (gross domestic product), employment, etc., led to the quarterly forecast results through 2020 shown in Figure 1.
Lewandowski chose one optimistic and one pessimistic scenario (a mild recession) and applied them to the forecasts. This provides a way of “understanding how different economic conditions can affect your industry,” he said. More detailed forecasts by industry also can provide a way of stress testing company performance under different economic conditions.
Figure 1. Quarterly results and forecasts using baseline, optimistic and pessimistic scenarios
Graph courtesy of MDM; sources: U.S. Census Bureau Monthly Wholesale Trade, MDM 2019 Wholesale Distribution Economic Trends Report
ECONOMIC DATA TO WATCH
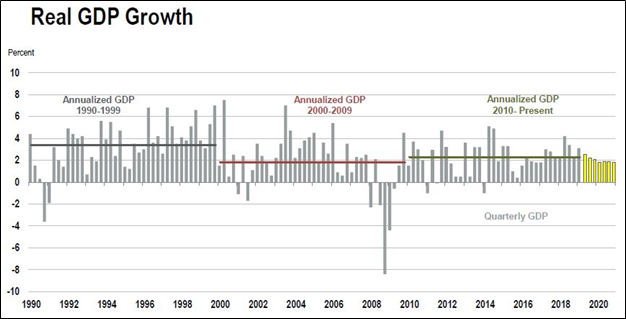
Among the economic data Lewandowski presented were historical and projected GDP (Figure 2). “Annualized GDP is on a growing but slowing track,” he said; The yellow bars in Figure 2 indicate this forecast for the next few quarters. Some sectors of the economy correlate with GDP, while others do not, mainly due to price fluctuations, notably in the oil and gas sector.
Figure 2. Real growth of GDP
Graph courtesy of MDM; sources: Bureau of Economic Analysis and Consensus Forecasts
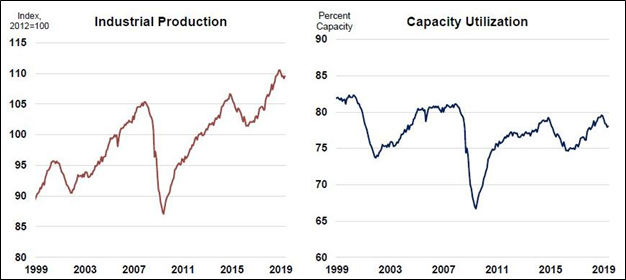
Two other sets of industrial data side by side show the relationship between the capacity for production and how much is produced (Figure 3). “Industrial production and capacity utilization are two good barometers for the economy as a whole,” Lewandowski said. “In general, we’re still pointing toward strong production but slightly less activity on the capacity utilization side. If you take a look over the long-term average, both of these are high, but they’re down a bit from where they were in late 2018.”
Figure 3. Industrial production and capacity utilization
Graph courtesy of MDM; source: Board of Governors of the Federal Reserve System
WHAT DOES THE FUTURE HOLD?
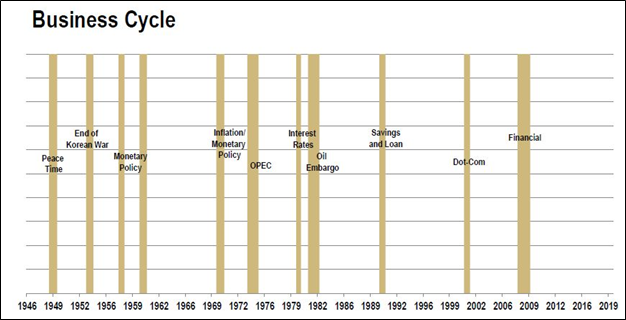
The question on everyone’s mind is “When will the next recession happen?” Lewandowski said. “We don’t know. We look at the causes of recessions and the probability of recessions.” He showed a graph of the 11 business cycles that have happened since World War II (Figure 4).
Figure 4. Business cycles since World War II
Graph courtesy of MDM; sources: National Bureau of Economic Research and the Business Research Division
The longest expansion after a recession lasted 10 years, in the 1990s, he said. The shortest was one year, with the average about 5 years. “Right now we’re tied for the longest post-World War II expansion. We don’t see anything immediate to interrupt that growth.”
In the past, a particular event precipitated each recession. The last five recessions, Lewandowski noted, were due to different causes: high interest rates, the oil embargo, the savings and loan crisis, the dot-com bust and the housing/financial meltdown. The question is what will be the next event? No one knows what the next trigger will be, he said.
He and other analysts continue to watch the fundamentals of the economy, such as wage growth and corporate earnings. “The expectations are somewhat low that we’ll be entering a recession this year,” Lewandowski said, “though we certainly do see a slowdown.”
Barbara Donohue is web editor for VALVE Magazine.
RELATED CONTENT
-
MSS Publishes Revised and New Industry Standards
The Manufacturers Standardization Society (MSS) of the Valve and Fittings Industry is excited to announce publication of the new Standard Practice SP-158-2021, Supplemental High-Pressure Gas Test Procedures for Valves.
-
The Final Control Element: Controlling Energy Transformation
When selecting control valves, be sure to properly evaluate the process conditions to identify potential issues and select the proper management techniques.
-
Additive Manufacturing of Pressure Equipment
How manufacturers can design and produce PED-compliant equipment using additive manufacturing.





 Unloading large gate valve.jpg;maxWidth=214)